Jun 15, 2020
How Strong is Your Preliminary Game?
How competitive have your Preliminary results been, where do you stand among your peers, and what scores should you be aiming for if a top finish is your goal? EquiRatings takes a statistical look at the USEA Preliminary level to help you evaluate your game. Stay tuned for the rest of the levels as they are released monthly!
How are people scoring at Preliminary?
Our first go-to is Zone Analysis. Zone Analysis is a great way to see how people are scoring, both overall and per-phase. Use these graphs to evaluate how you’ve been scoring relative to your Preliminary peers. We get you started with a few bullet-point takeaways below.
A few graph takeaways
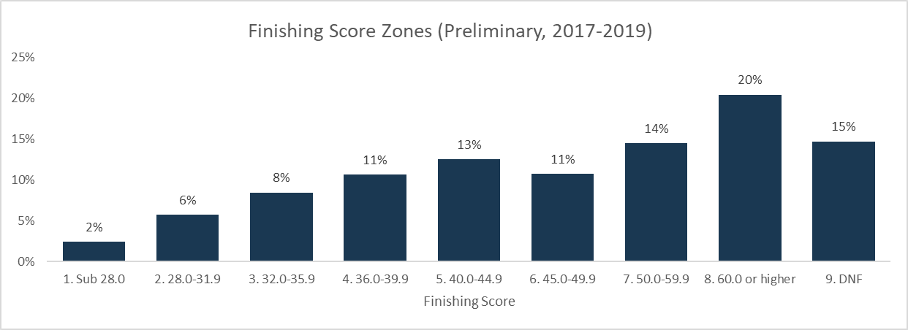
Finishing Score Zones
- Sub-28 Zone: Only 1 in 50 (2%) Preliminary starters finish sub-28.
- 60+ Zone: On the other end of the spectrum, 1 in 5 Preliminary starters (20%) finish in the 60+ zone.
- 36 to 50 Zones: About 1 in 3 Preliminary starters (35%) finish in the 36 to 50 range.
- 50+ Zones: About another 1 in 3 Preliminary starters (34%) finish on a score of 50 or higher.
- DNF: Out of every 20 Preliminary starters, 3 do not finish the competition (15%).
- Sub-36 Zones: Similar to the DNF zone, about 3 in 20 Preliminary starters (16%), finish sub 36.0.
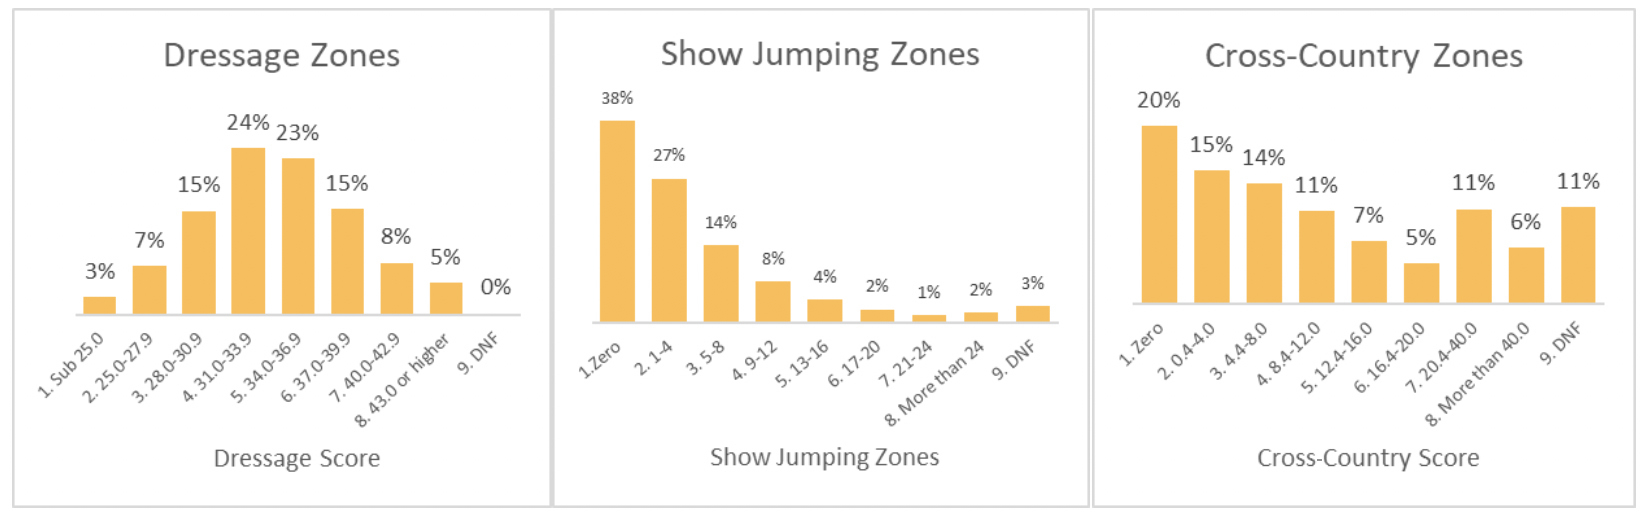
Per-Phase Zones
Note: The Show Jumping Zones and the Cross-Country Zones include time and jumping penalties.
- 1 in 10 Preliminary starters (10%) earns a sub-28 dressage score.
- Nearly half of Preliminary starters (47%) produce a dressage score in the 31 to 37 range.
- Most Preliminary starters (65%) earn 4 or fewer show jumping penalties.
- 1 in 5 Preliminary cross-country starters (20%) finish clear and inside the time.
- About half (49%) of Preliminary cross-country starts finish with 8 or fewer penalties.
- Over 1 in 10 (11%) Preliminary cross-country starts do not complete the phase.
What does it take to place high at Preliminary?
We all know that eventing is about putting all three phases together to finish strong, but what is a strong finish? What does it take to earn a top placing and how does a performance in a single phase affect your overall competitiveness? Here we show you the results achieved by first and third place finishers so you know what a top performance looks like.
TOP FINISHING SCORES
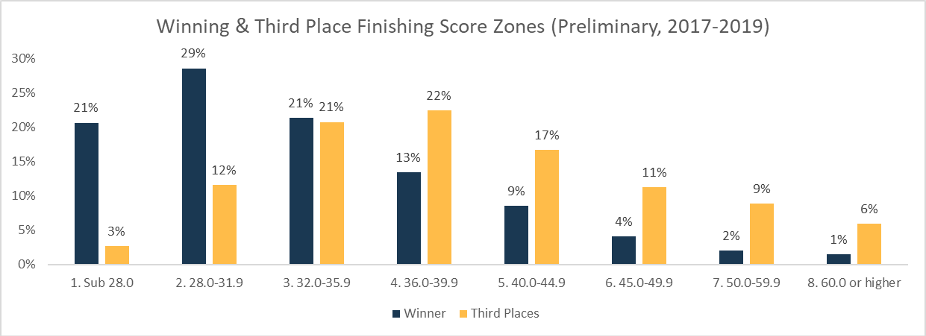
A few takeaways
- 50% of Preliminary winners finish on a sub-32 score.
- About 1 in 5 Preliminary winners (21%) finish sub-28. However, that same percentage of winners come from the 32 to 36 zone.
- Only 3 in 20 third-place finishers (15%) earn a sub-32 score.
- A Preliminary score in the 32 to 45 range still gives you a strong chance at a third-place finish. 3 out of 5 (60%) third-place finishers come from this range.
Top Dressage Results
What does a strong start look like at the Preliminary level?
|
Final Position |
Average |
Started as |
Started 10 Marks or Less from Dressage Leader |
Started More Than 10 Marks From Dressage Leader |
|
Winner |
30.0 |
37.0% |
60.6% |
2.4% |
|
3rd Place |
32.9 |
8.0% |
77.8% |
14.2% |
Using 2017 – 2019 Prelim data.
A few takeaways
- The average dressage score of a Preliminary competition winner is 30.
- The majority of eventual competition winners (about 3 in 5 or 61%) are not the dressage leader but are within 10 marks of the leader after the first phase. The same can be said for third-place finishers with nearly 4 in 5 (78%) coming from within 10 marks of the dressage leader.
- Only about 2% of eventual competition winners come from more than 10 marks behind the dressage leader.
Top Show Jumping Results
Can you afford to knock a pole?
|
Final Position |
0 Show Jumping Penalties |
1 to 4 Show Jumping Penalties |
5 or More Show Jumping Penalties |
|
Winner |
73.0% |
19.3% |
7.7% |
|
3rd Place |
50.7% |
30.8% |
18.5% |
Using 2017 – 2019 Preliminary data. This table includes show jumping time penalties and jumping penalties.
A few takeaways
- A clean show jumping round is critical to your chance of winning at the Preliminary level. Nearly 3 out of 4 competition winners (73.0%) keep all the rails up and finish under time.
- Nearly half of third-place finishers (49.3%) do incur show jumping faults but, of these, most incur just 1 to 4 penalties.
Top Cross-Country Results
Do you need to be clear inside the time?
|
Final Position |
Clear Inside the Time |
Average Cross-Country Time Penalties |
|
Winner |
54% |
2.2 |
|
3rd Place |
33% |
4.7 |
Using 2017 – 2019 Preliminary data.
A few takeaways
- We know a clean jumping cross-country round is critical to success, but only about half of Preliminary winners finish cross-country clear and inside the time.
- Across all Preliminary winners, the average time penalties is just 2.2 (5-6 seconds over the time).
- 1 in 3 third-place finishers complete cross-country clear and inside the time.
- Across all third-place finishers, the average time penalties is 4.7 (about 12 seconds over the time).
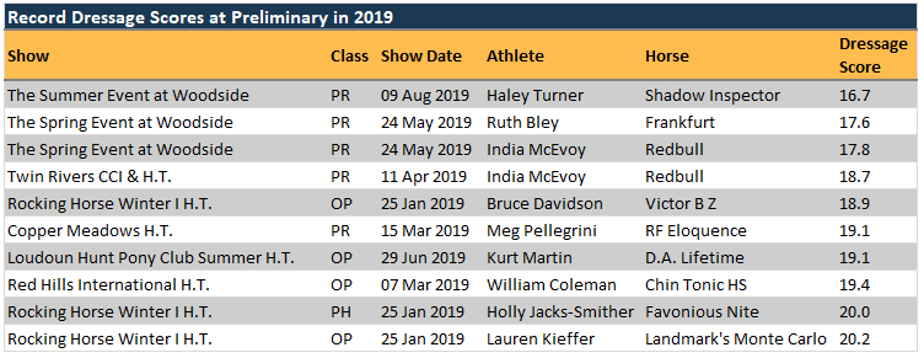
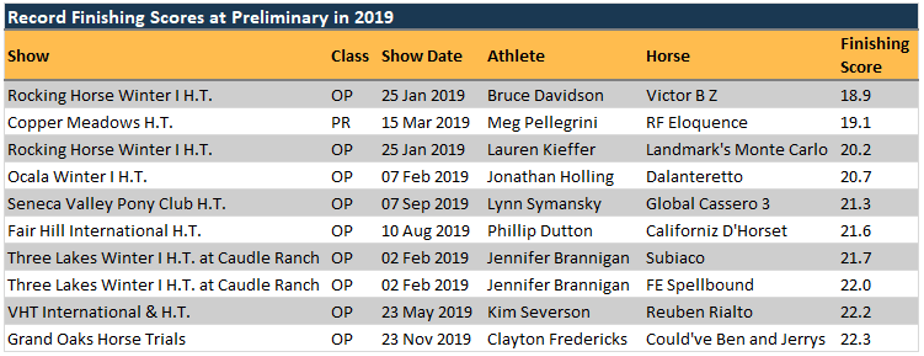
What are the 2019 record performances?
Lastly, we have pulled the 2019 Preliminary record dressage scores and record finishing scores. There are some recognizable names on these lists but also some combinations who may not always make the eventing headlines. Take a look – these numbers might be your reach goals!
How can you use these numbers?
Looking at these types of peer analyses allows you to gain clarity and set measurable targets. Measurable targets are so valuable! They help you purposefully improve by working toward a concrete target and gauging your progress toward the bullseye. Of course, long-term goal-setting is not about comparison; you have to stay in your lane or risk being robbed of fulfillment. But these comparison metrics do help you locate yourself among your peers so you know where you stand. From there, you can set realistic targets that can serve as rewarding stepping stones in your journey.
May 12, 2025
Eventing News
Boyd Martin and Cooley Nutcracker Conquer Yanmar America Tryon International CCI4*-L
The final day of competition at the the Yanmar America Tryon International Spring Three-Day Event presented by Tow & Collect crowned five new champions, featuring show jumping competition in Tryon Stadium and the final rounds of cross-country competition on the White Oak cross-country course at Tryon International Equestrian Center & Resort (Tryon International). Read more below.
May 12, 2025
Eventing News
From the Democratic Republic of the Congo to Cross-Country: Miriam Keefer’s Eventing Journey
At last fall's Full Moon Farm Horse Trials, 16-year-old Miriam Keefer guided her horse, Micky, over the final cross-country jump with quiet determination and a flash of joy. It was her first recognized event at the Novice level, and she placed second out of 16 competitors—qualifying her for both the USEA American Eventing Championships presented by Nutrena Feeds and a long-format three-day event.
May 11, 2025
Eventing News
Canter and Lordships Graffalo are Back on Top at MARS Badminton Horse Trials
Ros Canter and Lordships Graffalo were pure class in the final, tense moments of the MARS Badminton Horse Trials, jumping faultlessly to regain the title they won two years ago by just 1 penalty.
May 11, 2025
Eventing News
Martin and Cooley Nutcracker Rise to the Top at Yanmar American Tryon International CCI4*-L
Day 3 of competition at the Yanmar America Tryon International Spring Three-Day Event presented by Tow & Collect showcased Clayton Frederick’s course design at the picturesque White Oak Cross-country course at Tryon International Equestrian Center & Resort (Tryon International). The leaderboard of the CCI4*-L division saw a shakeup after two phases of competition.