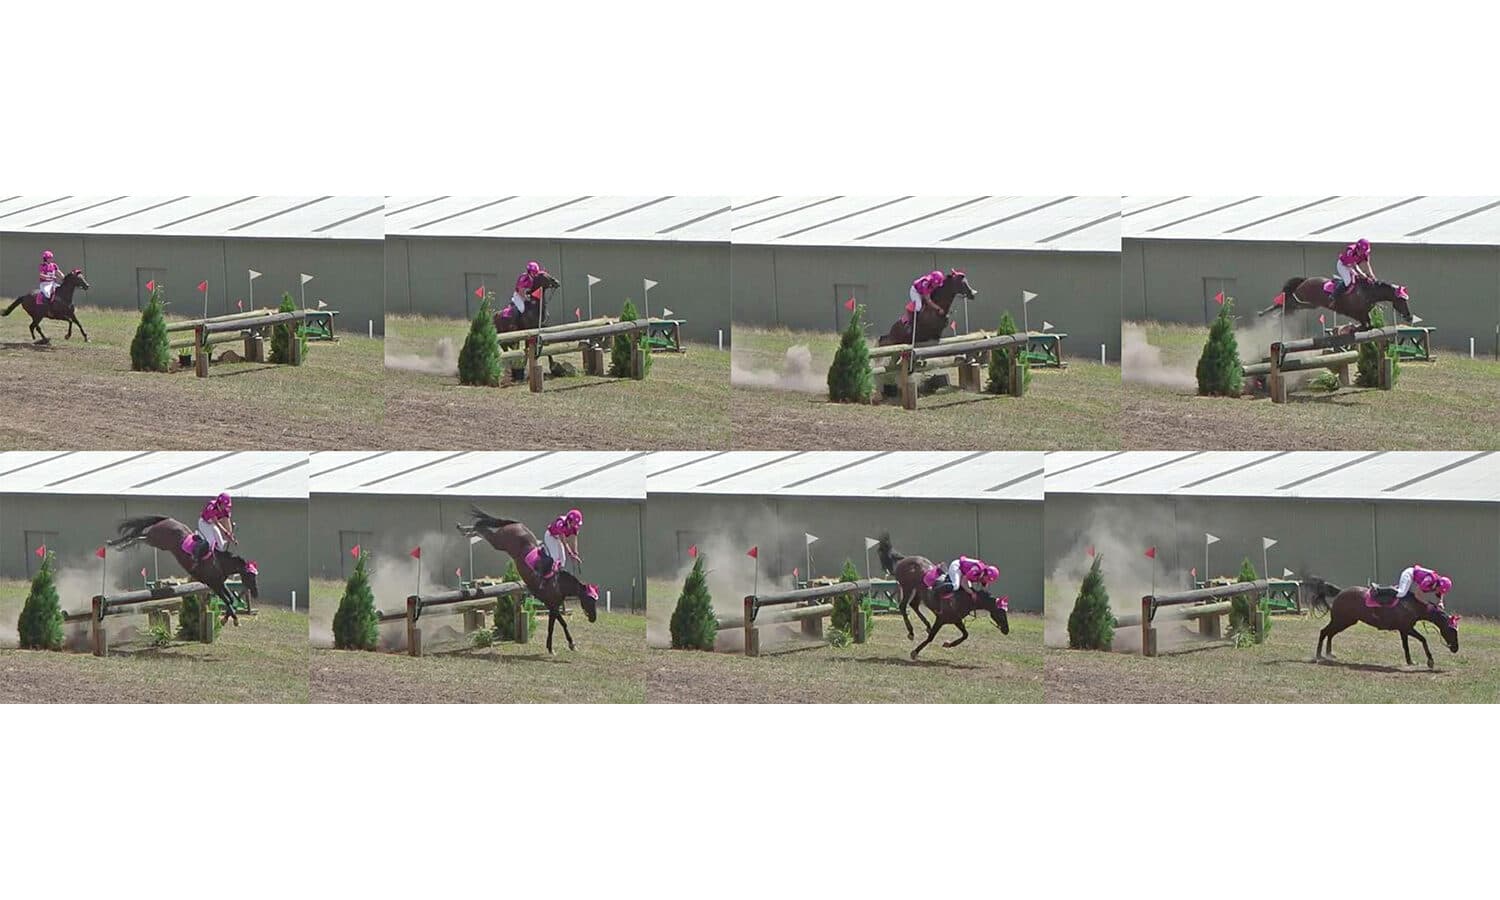
Safety Concepts for Every Ride: Simulations for Reducing Cross-Country Rotational Falls
The USEA Collapsible Fence Technology Study was conducted through the University of Kentucky in 2016-2018 and Dr. Suzanne Weaver Smith and Shannon Wood reported on the study’s findings in the May/June Issue of Eventing USA. All USEA members receive a subscription to the award-winning magazine. Join today to subscribe.
For more than two decades, the sport of eventing worldwide has focused policy, research, and design innovation to increase understanding and reduce the occurrence and consequence of horse and rider injury. Fédération Equestre Internationale (FEI) statistics from 2002 show nearly 75 percent reduction of any rider injury. Since the introduction of the first cross-country safety device, the frangible pin in 2001, serious rider injuries (that are correlated to rotational falls) have seen two-thirds reduction by 2015. Everyone’s goal is further reduction to the minimum possible.
Reducing the Risk of Rotational Falls
Reason1 presented a “swiss cheese model” that can be thought of as layers of preparation for success, but if a hole in each layer is encountered, there may be catastrophic results. The United States Eventing Association (USEA) and U.S. Equestrian Federation (USEF) Eventing Safety Summit held June 7-8, 2008 considered course design, veterinary/medical, qualifications, education, personal safety equipment, and cross-country safety devices with the goal of reducing horse falls in general, and rotational falls specifically.
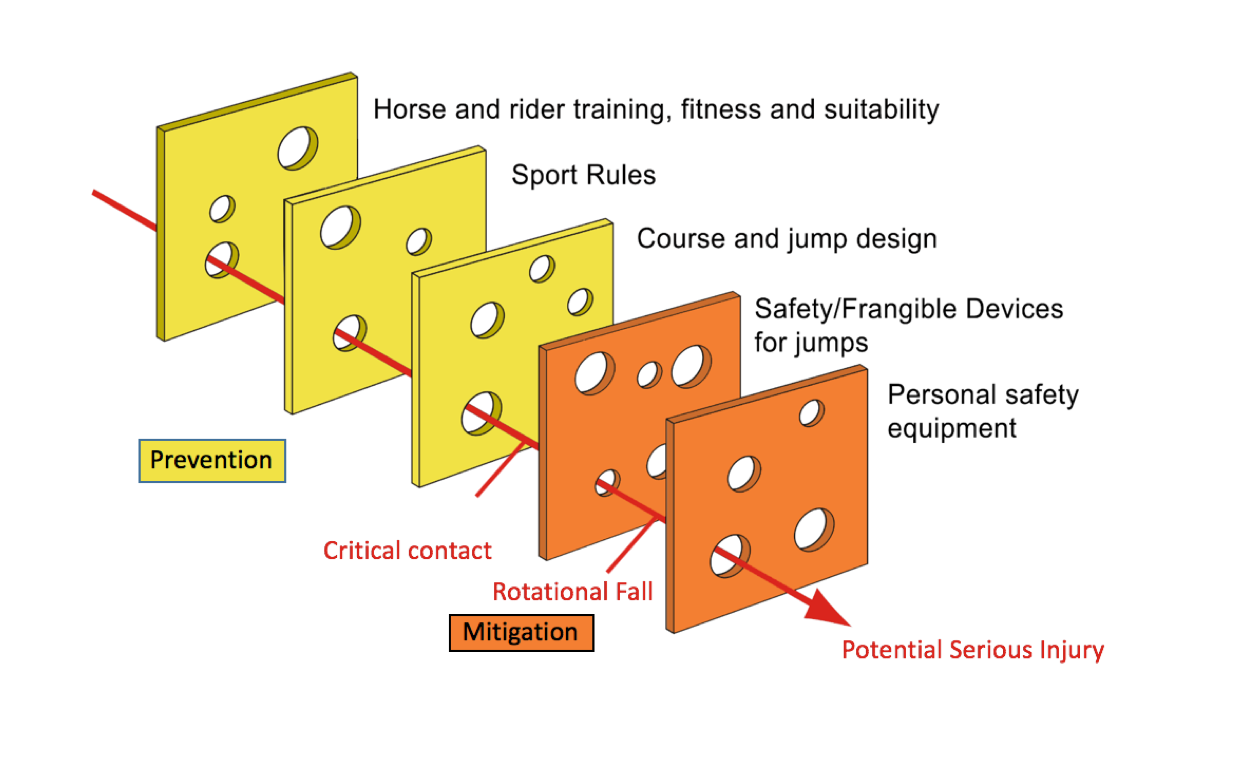
Elimination of dangerous outcomes from rotational falls happens in two phases: preventing the situation from occurring and mitigating the consequences once the competitor has hit the fence. Today, prevention is accomplished through layers of policies and best practices for training, qualifications, sport rules, and course and jump design to prevent the horse and rider hitting the fence in the critical foreleg region associated with rotational falls. Mitigation layers reduce the risk through the action of fence safety devices like frangible pins and MiM clips, and if that fails, with safety equipment such as helmets and body protectors to minimize consequences.
The focus and purpose of the University of Kentucky rotational fall safety study became physics-based computer simulations of the critical moment of forearm horse-fence contact, validated with available data with the goal to enable more availability and diversity of safety device options. With more options, the safety device mitigation layer will be strengthened, further reducing the potential for serious injury. Because of the wide variety of questions in cross-country, there should be more options for safety devices tuned to those situations.
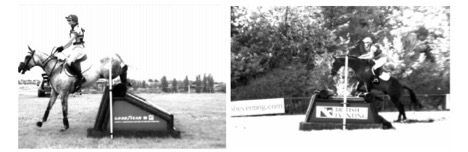
Safety studies from 2008-2011 provided important foundation information and validation data. For example, British Eventing and Competitive Measures, Inc. had instrumented galloping fences on cross-country courses in 2008 and 2009 that measured the force and how often the fence is contacted by hoof strikes and other normal contacts when the horse and rider continue on course. No rotational falls occurred (no study to date has measured forces for a rotational fall). The portable, adjustable fences were placed on course for 32 days of competitions. University of Kentucky safety device testing at that time confirmed hard contacts were similar force to a sledgehammer hit.
These results help us understand the numbers of potential rotational fall occurrences each year as we work to prevent and mitigate them. It is important to recognize how rare rotational falls are through a “by the numbers” for one typical year.
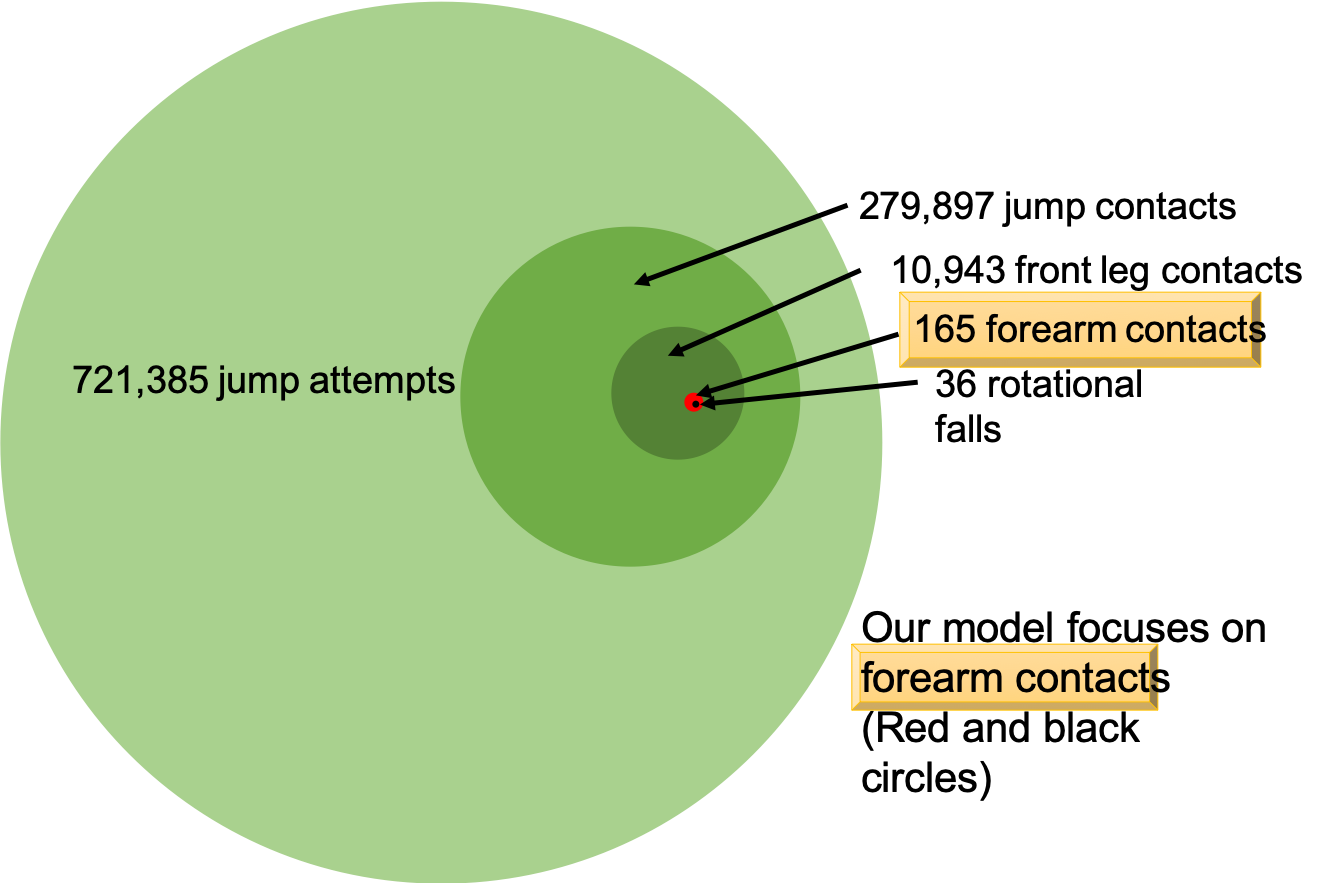
- If each starter approaches about 35 jumps per course, there are 721,385 jump attempts/year.
- Of each attempt, if 38.8 percent make contact (from BE instrumented fence results), there are 279,897 contacts/year. Under these conditions, safety devices should activate when needed to prevent rotational falls, and not otherwise.
- Of each contact, if 3.91percent are front hoof/leg (from BE instrumented fence results), the result is 10,943 front leg contacts/year.
- Of all front-leg contacts, rarely (1 in 66 from BE instrumented fence results) are in the critical forearm range, yielding 165 forearm contacts/year. Forearm contacts, sometimes called hanging a leg, are associated with rotational falls and close calls.
- And of these forearm contacts for this typical year, there were 36 rotational falls.
Reducing this risk of rotational falls even further is the goal.
The Kentucky Computer Simulation
From the “by-the-numbers” infographic above we can see why it is so difficult to be in the exact place at the exact time on course to measure data for rare forearm contacts and extremely rare rotational falls. Even if we could have video recordings everywhere, it might take years to measure enough different situations for data science to be useful for mitigating others. Alternatively, in past studies, building and testing a physical model like a crash test dummy, helped provide understanding, but only represented one or a few different fence approaches.
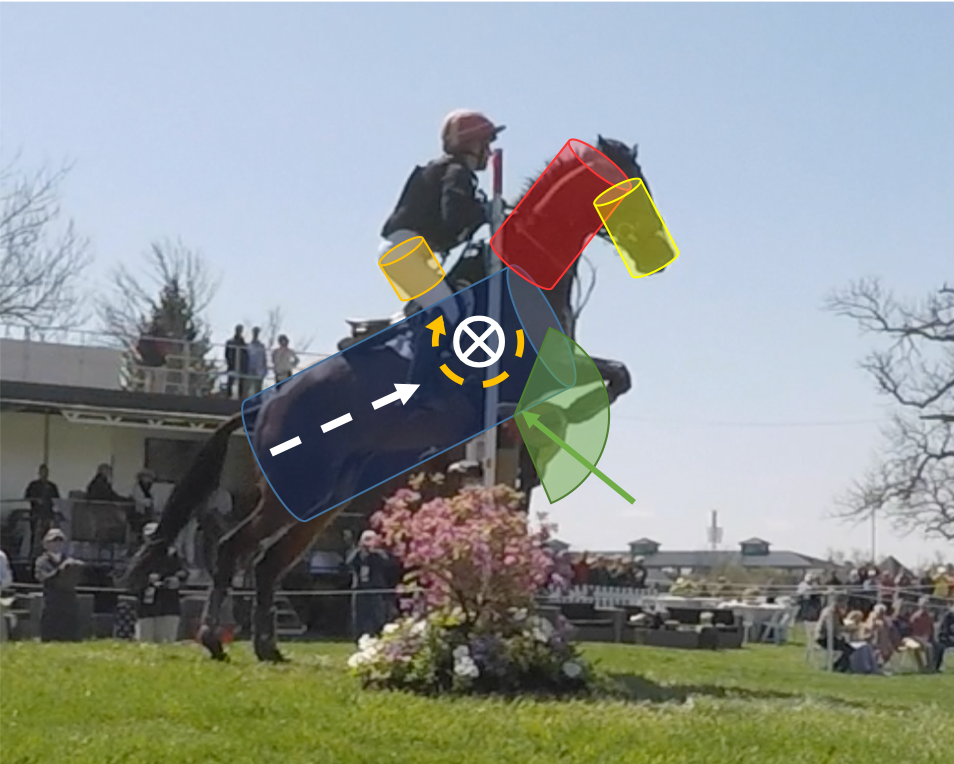
The Kentucky computer model represents a statistical population of horses and riders, each at the instant of forearm contact, with four cylinders in an articulated configuration to appropriately approximate the distribution of mass. The simulations compute large numbers of independent results, each using random samples of variables, and yield overall statistical ensembles of outcomes.
In horseman’s terms, the model creates a field of competitors of different sizes and shapes, all hanging a leg at different questions at a variety of speeds and jumping positions including different jumping distances like what is seen in competition.
From physics we know that the contact force (green arrow in figure 4) is key, but the duration of contact is also important. The combination of force and time (i.e., impulse), along with mass and velocity (i.e., momentum), both contribute to the result when a collision occurs. With rotational falls, forward momentum (white arrow) changes to rotational motion (yellow arrow) when forearm contact is made. For rotational motion, the shape of the rotating mass (i.e., inertia) is also important.
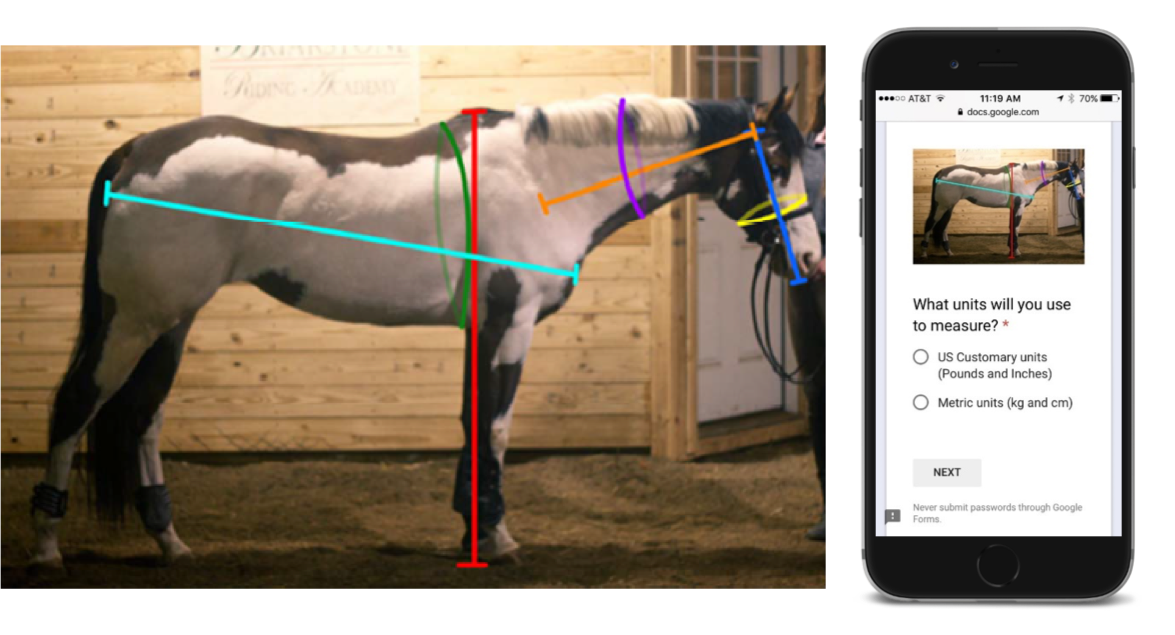
Published technical papers did not have sufficient information to model the population of horses and riders, so a survey was developed in 2017 to solicit measurements from the eventing community. Data from more than 400 horses and riders was compiled thanks to numerous riders and owners, providing an appropriate statistical basis for the Kentucky computer simulations. Simulation results show the inertia, or resistance to rotation, varies by +/- 30 percent or more over the range of situations.
From an equestrian perspective, the variable body position angles create any possible jumping position within a range of values accounting for fences of different heights, terrain changes, spreads, and fence shapes, as well as different takeoff distances, positions along the jump arc at contact, and jumping techniques. These factors all contribute to the inertia and center of gravity values resulting in the model. The body position and the speeds also account for the results of variation of footing, jump placement, and sequence.
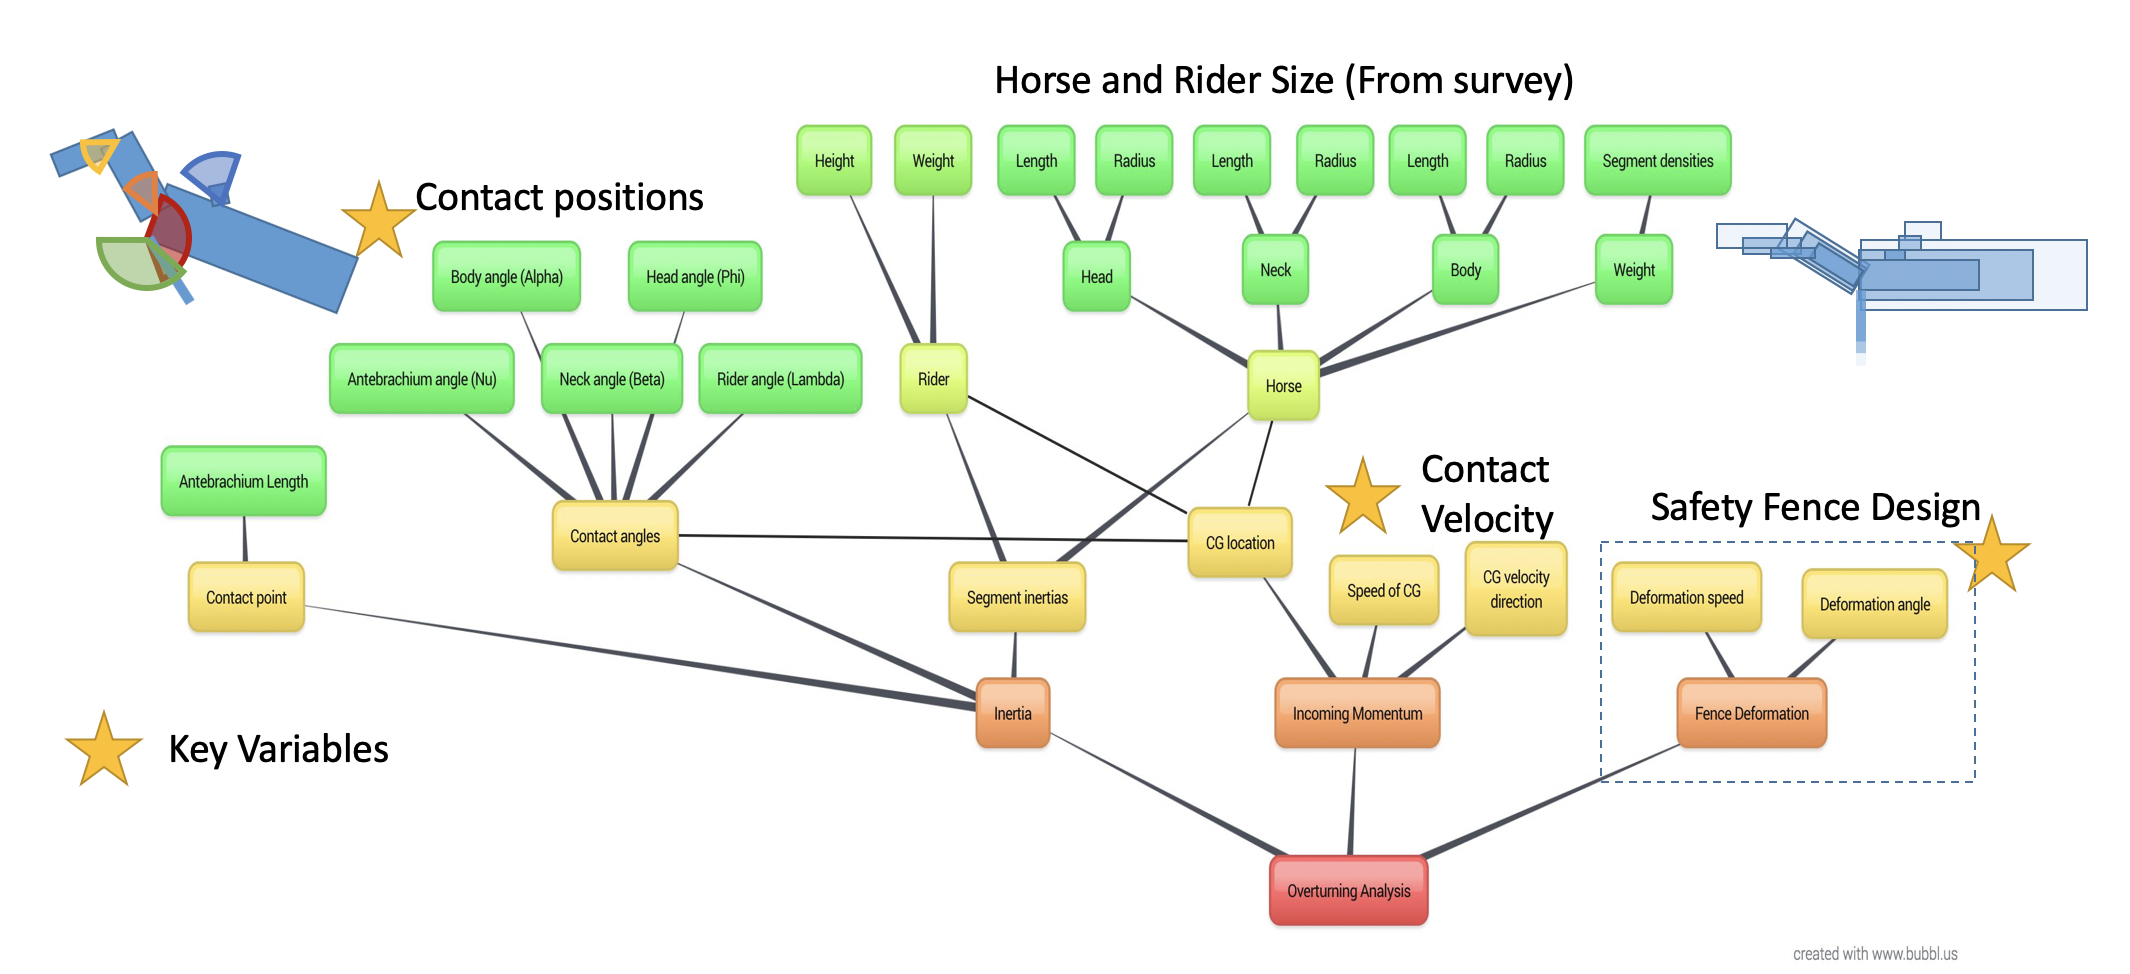
A map of the 33 variables within the simulation is shown in Figure 5. The underlying complexity that comes from so many interacting variables contributes to different interpretations of the causes of rotational falls.
Jumping speed is different than the average on-course speed. All competitors were videotaped at the Kentucky Three-Day Event from a viewpoint perpendicular to the jump for two different questions: a galloping oxer in 2017, and an open vertical into a combination in 2018. Only one forearm contact and no rotational falls occurred.
Validation of the computer simulation, at each step along the way and overall, was important to have confidence in the results. Validation was accomplished with inertia information from the scientific literature, along with available data from prior testing of physical models and side-by-side comparison testing of safety devices at MiM in 2011. Rotational fall videos were analyzed to provide rotation rates that verified intermediate results. Overall, the number of rotational falls resulting in the simulation is also consistent with annual statistics.
Results
Any design that limits the force of the contact with the fence, whether frangible mechanisms, friction-reducing surfaces, angled front faces, resettable moving subparts, or new concepts yet to be developed, will reduce the risk of rotations, and are most effective for high-speed contact.
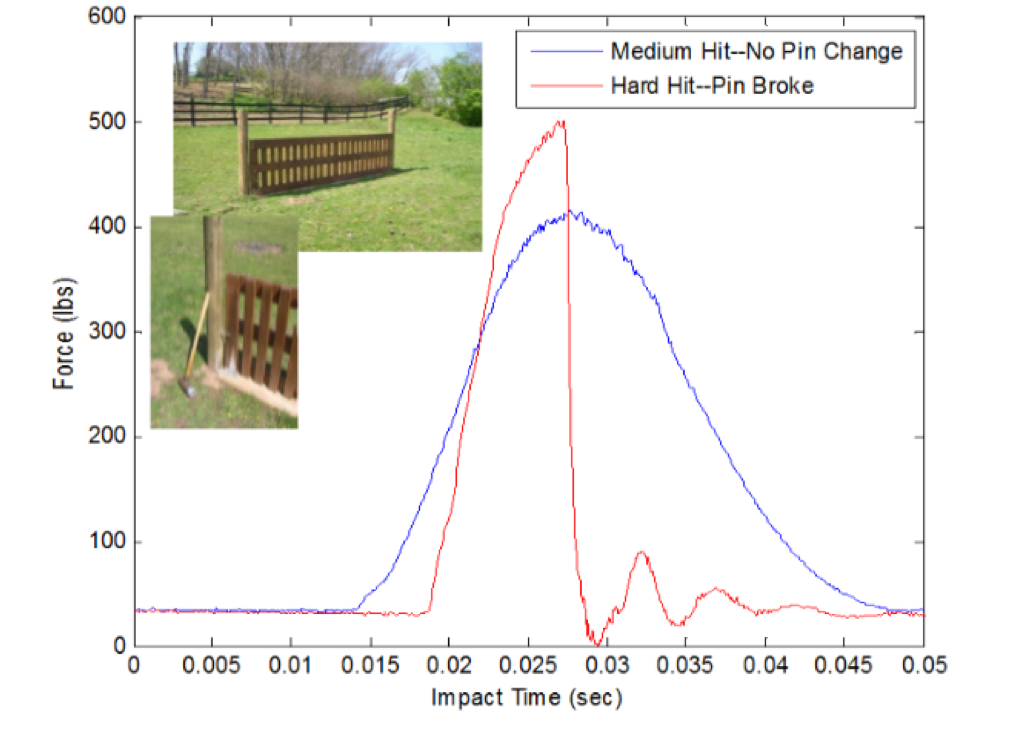
When a safety device activates, it interrupts the contact force between the fence and the horse. As an example, for the Kentucky hinged gate shown in figure 6 (from the previous testing study), a smaller frangible pin was incorporated as the safety device. When the gate was contacted with an instrumented sledgehammer at a lower force level (blue), the pin did not activate. However, when hit slightly harder (red), the pin broke to interrupt the time of the reaction. Friction-reducing surfaces can lower the peak force; other designs can reduce the combination of force and time.
Designs that limit the reaction to an impulse between 500-1000 N-s in all directions were effective in reducing risk of rotation, while minimizing the possibility of activation during other contact. Solutions tailored to jumping speeds and angles can reduce risk over off-the-shelf solutions, however research is ongoing to understand contact speed for different questions for design of safety devices that provide specific directional limits to the contact reaction.
Ongoing and Future Research
The Kentucky computer simulation is now a validated, physics-based tool to 1) simulate safety design performance (envisioned and existing), 2) compare safety designs and placement for specific questions, 3) evaluate/define tolerances for standards, 4) define requirements for testing systems, and 5) define risk of fixed-fence questions.
The current focus is how to best communicate the simulation results for safety device and course designers/builders use, gathering more on-course contact velocity data to distinguish questions and potential design solutions, completing peer-reviewed publications so that the sport of eventing, and other equestrian sports, can benefit from the inertia models and other aspects of this research.
Acknowledgments
The authors appreciate Dan Michaels, the USEA Safety Committee, and the many eventing and equestrian sport professionals who contributed to the study by offering their observations, questions, and expertise. Financial support provided by Jacqueline Mars, the University of Kentucky, the USEA Foundation, and donors to USEA made this research possible. Hundreds of owners and riders measured and contributed their horses’ data to the survey, including Ellen Sadler’s Capitol Farms in St. Louis, Mo. and horse Hugo, Midsouth Horse Trials, Champagne Run Horse Trials, Dauntless Sport Horses, Clearview Equestrian Center, Montgomery Equestrian, Antebellum Farm, the Event at Rebecca Farm, Ashley Kehoe Eventing, LLG Eventing, and the 2019 USEA Instructors’ Certification Program (ICP) Symposium. Finally, we thank the University of Kentucky students involved with the current study and those students and collaborators who laid the foundations during the 2009-2011 testing study.
References
Reason, J. (2000), “Human error : models and management,” BMJ, vol. 320, no. March, pp. 768–770.
About the Authors
Dr. Suzanne Weaver Smith began her 38-year career working in aerospace systems R&D at Harris Corporation with guidance system launch vibration modeling and testing for the Hubble Space Telescope. Her research since then has focused on analysis and testing of challenging dynamics problems including International Space Station vibrations, Mars Airplane deployment, and Unmanned Aircraft Systems R&D. Dr. Smith has successfully led numerous research projects that develop and translate innovative and valued results for industry and societal benefit. For eventing, she and a team of University of Kentucky (UK) engineering students tested frangible and resettable designs from 2009-2011. Simulating the dynamic transition from forward to rotation motion brought together her analysis and testing experience to produce results for sport safety.
Shannon Wood is a Mechanical Engineering Masters student at the University of Kentucky and has been a member of the UKY Eventing Team for three years. She competes in Novice eventing.
Watch the video of Dr. Suzanne Weaver Smith and Shannon Wood's presentation from the 2018 USEA Annual Meeting & Convention:
Read past updates on the Frangible Fence Study:
- USEA Collapsible Fence Study Year One Update (January 9, 2017)
- USEA Collapsible Fence Study: Update from University of Kentucky (September 14, 2016)
- USEA Collapsible Fence Study Garners Tremendous Response (May 13, 2016)
Related Articles

Jerome Broussard Named as U.S. Eventing Hall of Fame Inductee for 2026
Since 1999, more than 50 horses and people have been inducted into the United States Eventing Association (USEA) Eventing Hall of Fame. Induction into the Hall of Fame is the highest honor awarded within the sport of eventing in the United States.
Young Eventer Elena McRae is Cleaning Tack at Rebecca Farm to Chase Her Breyerfest Dream
If you’re at The Event at Rebecca Farm (Kalispell, Montana) this week, you may have noticed a little handwritten sign pasted on the door of some of the porta potties that displayed 10-year-old Elena McRae’s tack cleaning service.

FEI Dressage Kicks off 25th Event at Rebecca Farm
Emotions are heating up along with the weather as The Event at Rebecca Farm marks its 25th year. Infinite blue sky and lush green grass set the stage for warm reflections of a brilliant history as horses and riders made the most of their chance to pursue their eventing passion here.
Official Corporate Sponsors of the USEA
Become a Sponsor